NEW REPORT: Billable hours this month
This week we released a new graph in the jobs report: the billable hours this month.
At the start of every month a number of working days and working hours is available to you and your team. To maximise turnover and profit, ideally, you try to log as many of those hours as billable time. The more billable hours you can book in a month, the more you are likely to invoice, either at the end of that month or at the end of the projects.
Some projects have a fixed price, but if your agency does a great deal of work by the hour, it is important to keep an eye on monthly billable time. If lots of people are on holiday or working on your own website, you are likely to bill out less time and that can influence your cashflow.
The billable hours this month area in the jobs report, lets you keep an eye on the monthly progression of timesheets and even gives you a projection of the highest achievable result for the month.
Let’s take a look at the different parts of this report:
- Max potential: Total number of hours available this month, based on staff working days and based on the team’s average hourly rate (as set in Streamtime). June 2019 has 20 working days. wayahead counts the working hours of each staff member to work out the total hours available. The graph on the left shows total hours, while the number on the right shows the monetary value, based on each team member’s billable rate.
- Target: Billable target for the entire team, as defined in the team preferences in wayahead and based on the team’s average hourly rate.
- Billable hours: Value of billable time entries so far this month. The monetary value is based on the sell value of logged time in Streamtime.
- Non billable hours: Sum of non billable hours so far this month. Of course, billable and non billable jobs, clients and items are defined in the reporting preferences in wayahead. Non billable hours are only shown as a time value. This is because the sell value of non billable time entries is often 0. E.g. 8hrs holiday will have a sell value of £0,00 in Streamtime. Adding up the total wouldn’t make any sense.
- Missing hours: This value is important! As the month progresses, we can expect the team to have logged a certain number of hours – whether billable or non-billable. wayahead will calculate how many working hours have passed since the start of the month. The it checks how much time is accounted for. The difference between the two is missing time. Hopefully the team will complete those timesheets later, but just in case, the number is clearly highlighted so you can see how much you are potentially missing out on! Needless to say, you don’t want to see any red on that dashboard.
- Projected result: Let’s say today is June 19th. There are 7 more working days this month. Let’s assume all hours of those 7 days are logged as billable time. That’s the maximum result you are able to achieve for the remainder of the month. In fact, chances are it’s going to be less than that, because you might rack up more unbillable time and missing time.
Projected result is the sum of billable time so far + remaining time this month and it can be compared to the target value.
The colour codes in the graph match the ones of the numbers on the side. The blue number in the middle of the graph is the number of billable hours so far this month. The outer graph shows the target, the middle one shows the expected result, the inner graph shows the progression so far this month. Hover over the graph to see more details.
News
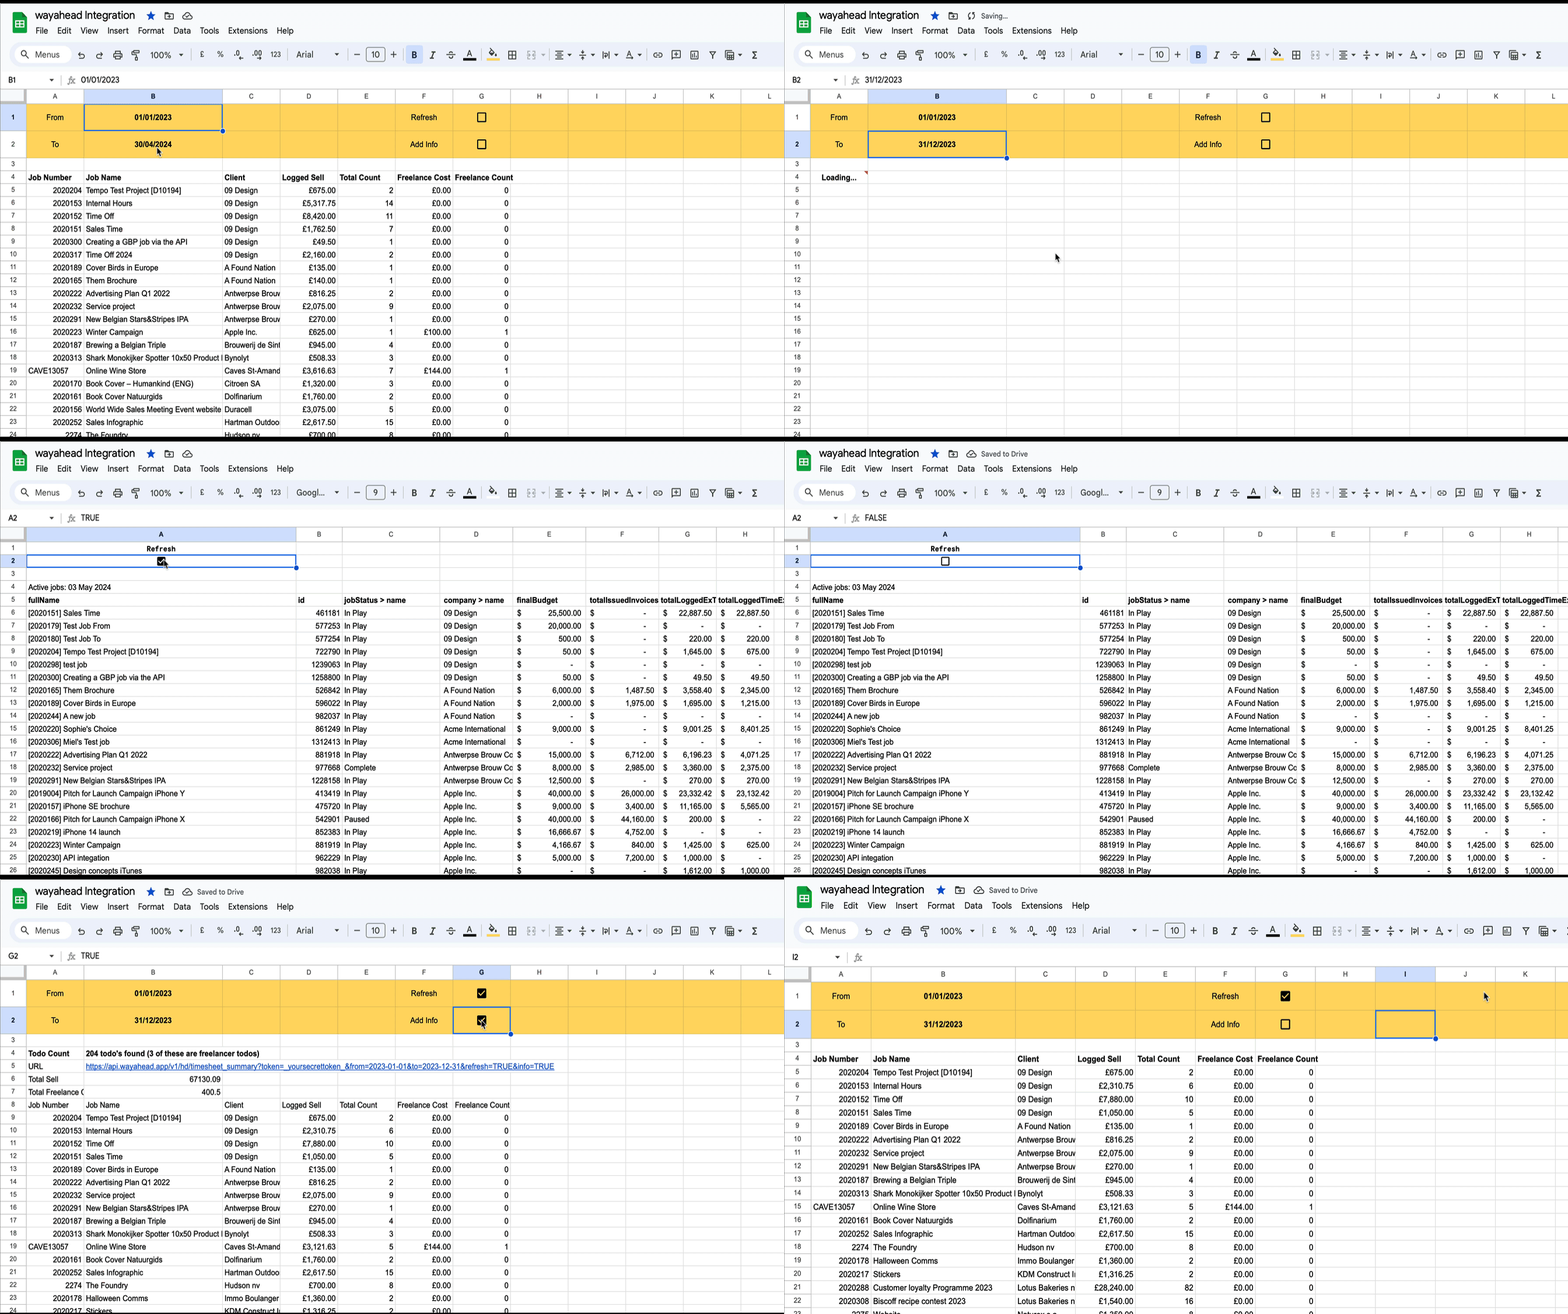
![Google Sheets Report]()
Reporting in Google Sheets
You can use Google Sheet's built in functions to create your own custom reports with Streamtime data that's always up to date. Importhtml simply calls a website/web app and fills in the returned table in the sheet.
New Interface
wayahead has a new interface! There is now more room on the page for the information that really matters: your reports! Especially on smaller the difference will be significant. And the new wayahead house style colours get a more prominent place!
