Product Updates: July 2020
This post gives a detailed overview of all the changes that were made in wayahead in June and July 2020.

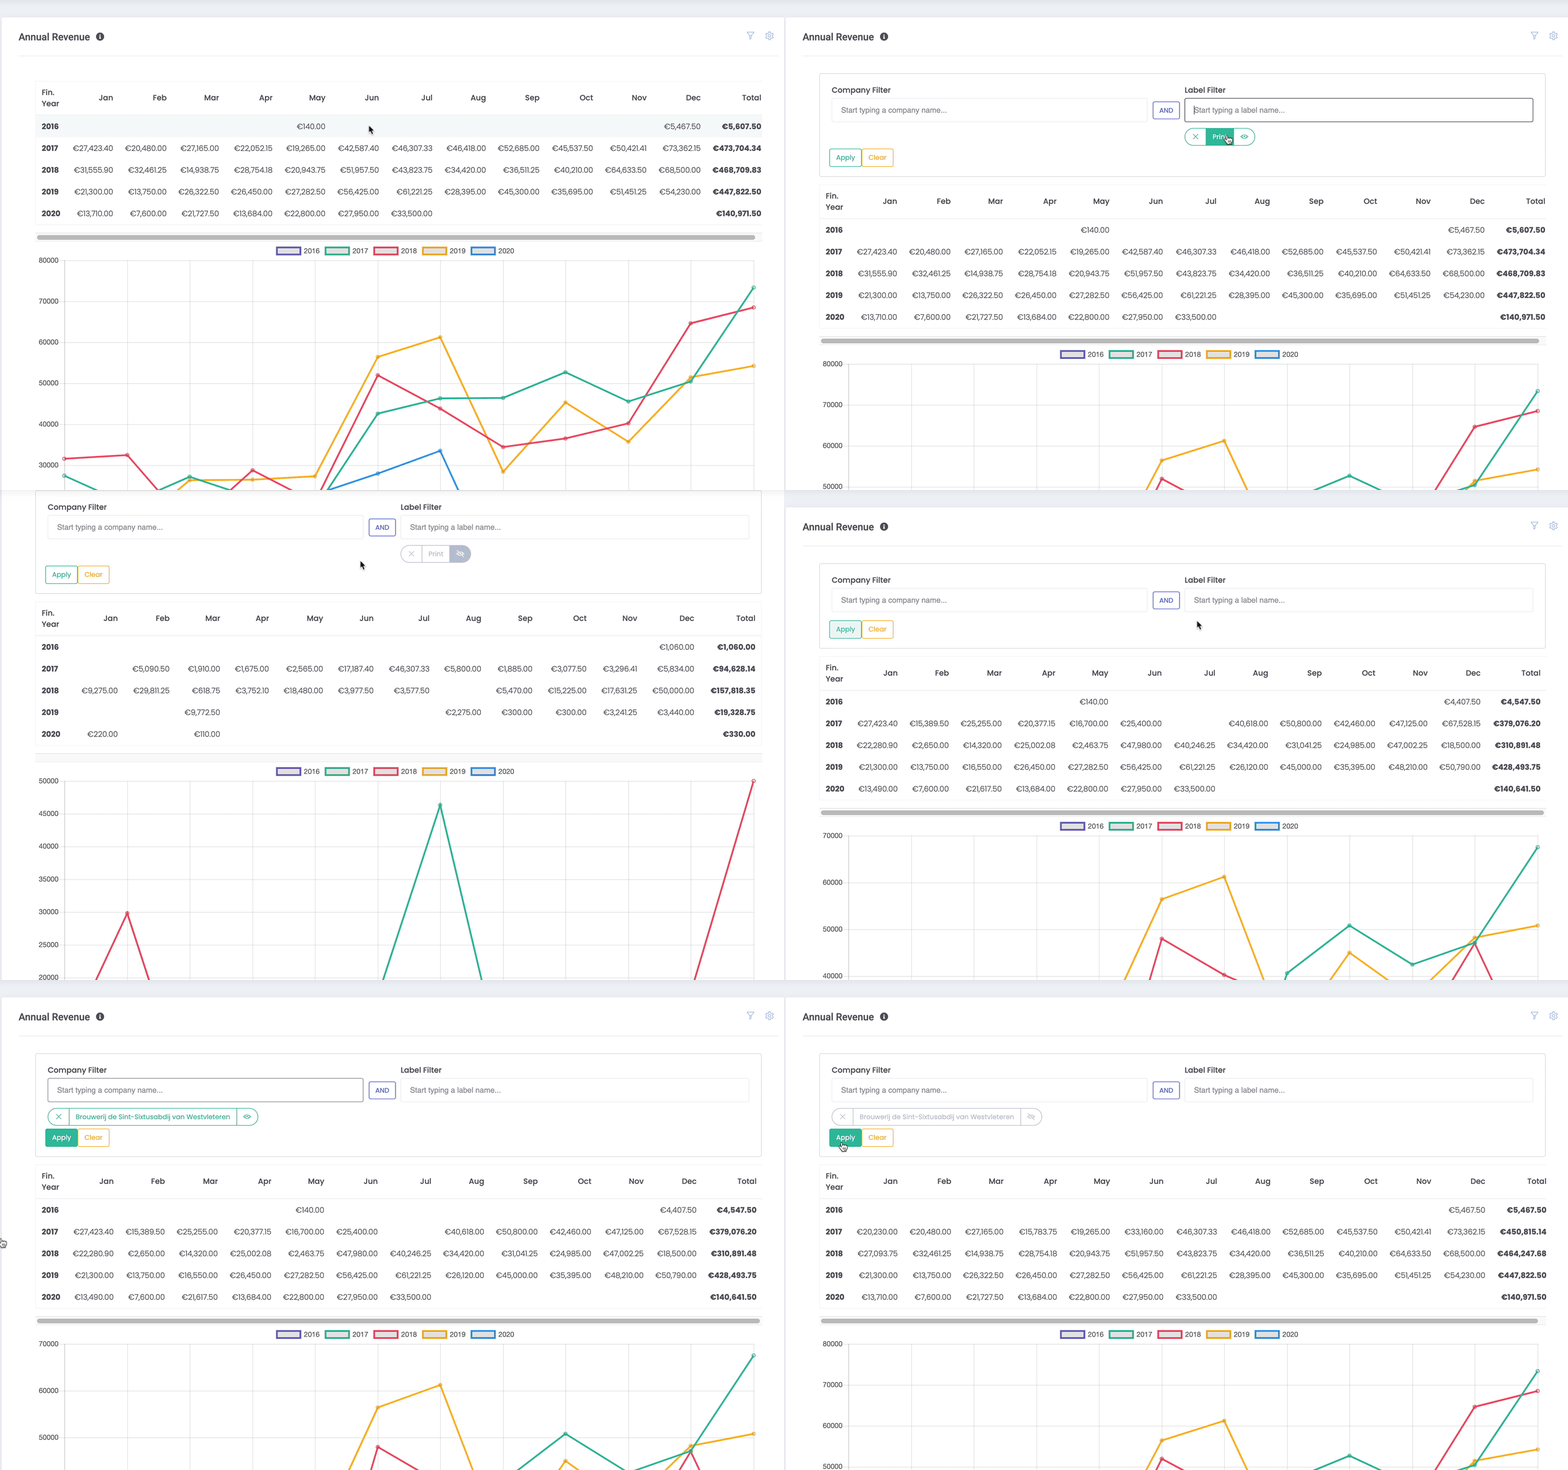
First of all, the Annual Revenue Report has a number of great improvements:
- There is now an option to filter by client name and job label. You can find the filter icon at the top left of the report. When applying filters you can choose to include or exclude specific customers or labels. This way you can find answers to questions like:
– how much did we invoice in Print over the last few years?
– how much turnover did we do across the company, except in Print?
– What would our turnover look like if we lost client A or B? - It now shows a list of related invoices at the bottom of the page. Invoices are grouped and totalled by month.
- It also has improved navigation. Click any value in the Overview to scroll to the details at the bottom. Then press the button at the bottom right to go back to the top of the page.
- All data can be output and exported to PDF/Excel/… (via the menu at the top right)

Improvements to timesheet reports across the board:
- In the Team Preferences > Streamtime Team, you can now choose to exclude certain staff members from all reports. This is useful for dummy users (e.g. for planning) or specific staff members (e.g. the accountant) who never record time in Streamtime anyway. These changes apply to the Utilisation, the Jobs report, the weekly timesheet PDF email and the monthly management report.
- Improvements to Slackers emails: A slacker is a … eehm, technical term… we use for people who aren’t completing their timesheets. The goal is to send those people reminder emails. By default, if you don’t complete 95% of the available time each week, wayahead will give you a friendly nudge.
But now you can change the threshold yourself. You may not be as strict and be happy with 80% of the week accounted for. Or you could send out multiple slacker emails. One on Wednesday night, where we expect 55% and another on Friday night where we expect 95% of the week completed.
- In the Utilisation report, some users would see the avatar circle (coloured circle inside the round graph), shifted up and misaligned. This was happening in Firefox and in some cases also in Chrome. This is fixed now.
Personalisation
- A while ago we introduced the customisation of your logo in the PDF emails. You can upload an image at the bottom of the Reporting Preferences.
- In the first version all logos would come out at 100x100px. But wayahead now allows you to upload rectangular logos too. Whatever size you upload, if it’s larger than 150px in the smallest size, it will resize automatically.

Improvements to Capacity Report
- The Capacity report now breaks down the planned time in ‘normal’, overdue and no due. Normal means all items that have a due date in the future. Overdue obviously means items with a due date in the past and no due is everything without a due date. You can use the toggles to remove each category individually to suit your needs.
- There is also an option to exclude paused jobs. This only applies to jobs that are completely paused, not individual items within jobs in play. The goal is to hide pipeline jobs, awaiting approval, but not in production yet.
- The item details respond smarter to all filters. Not only will the items be hidden based on the checkboxes for overdue, no due and paused jobs, it will also hide them based on the date slider.
- There were also some bug fixes, e.g. the colours of the graphs were reversed and in some cases, the planned time wasn’t calculated correctly. That’s fixed now.
Improvements to the Forecast Report
- The filters were improved making it faster to only show your own jobs. In case there are more than 2 account managers, a button will appear to check or uncheck all.
- There was some confusion around the invoice total at the bottom of the table. A tooltip was added to make it clear this does not just show total for the listed jobs, but may also include archived jobs not listed anymore.

Output Timesheets
- Extra styling options (classes) were added to the time table, allowing you to use CSS to further customise the look and feel based on status (completed / incomplete) or type (billable / non billable / sales).
- An extra column was added for type (billable / non billable / sales), which can be toggled to show or hide.
- The report can also be grouped by type now.
- It is now possible to save the report directly as a PDF, rather than sending it as an email. This is especially useful if you want to use a time report internally, e.g. to see details of what’s planned for the next week, or to get a list of incomplete todos in the past.
Overall changes
- Improved error handling overall.
- Resolved issue where password reset would fail if the user had 2 accounts.
- Improved error handling with new API limits in Streamtime, of maximum 60API requests per minute.
News
![Google Sheets Report]()
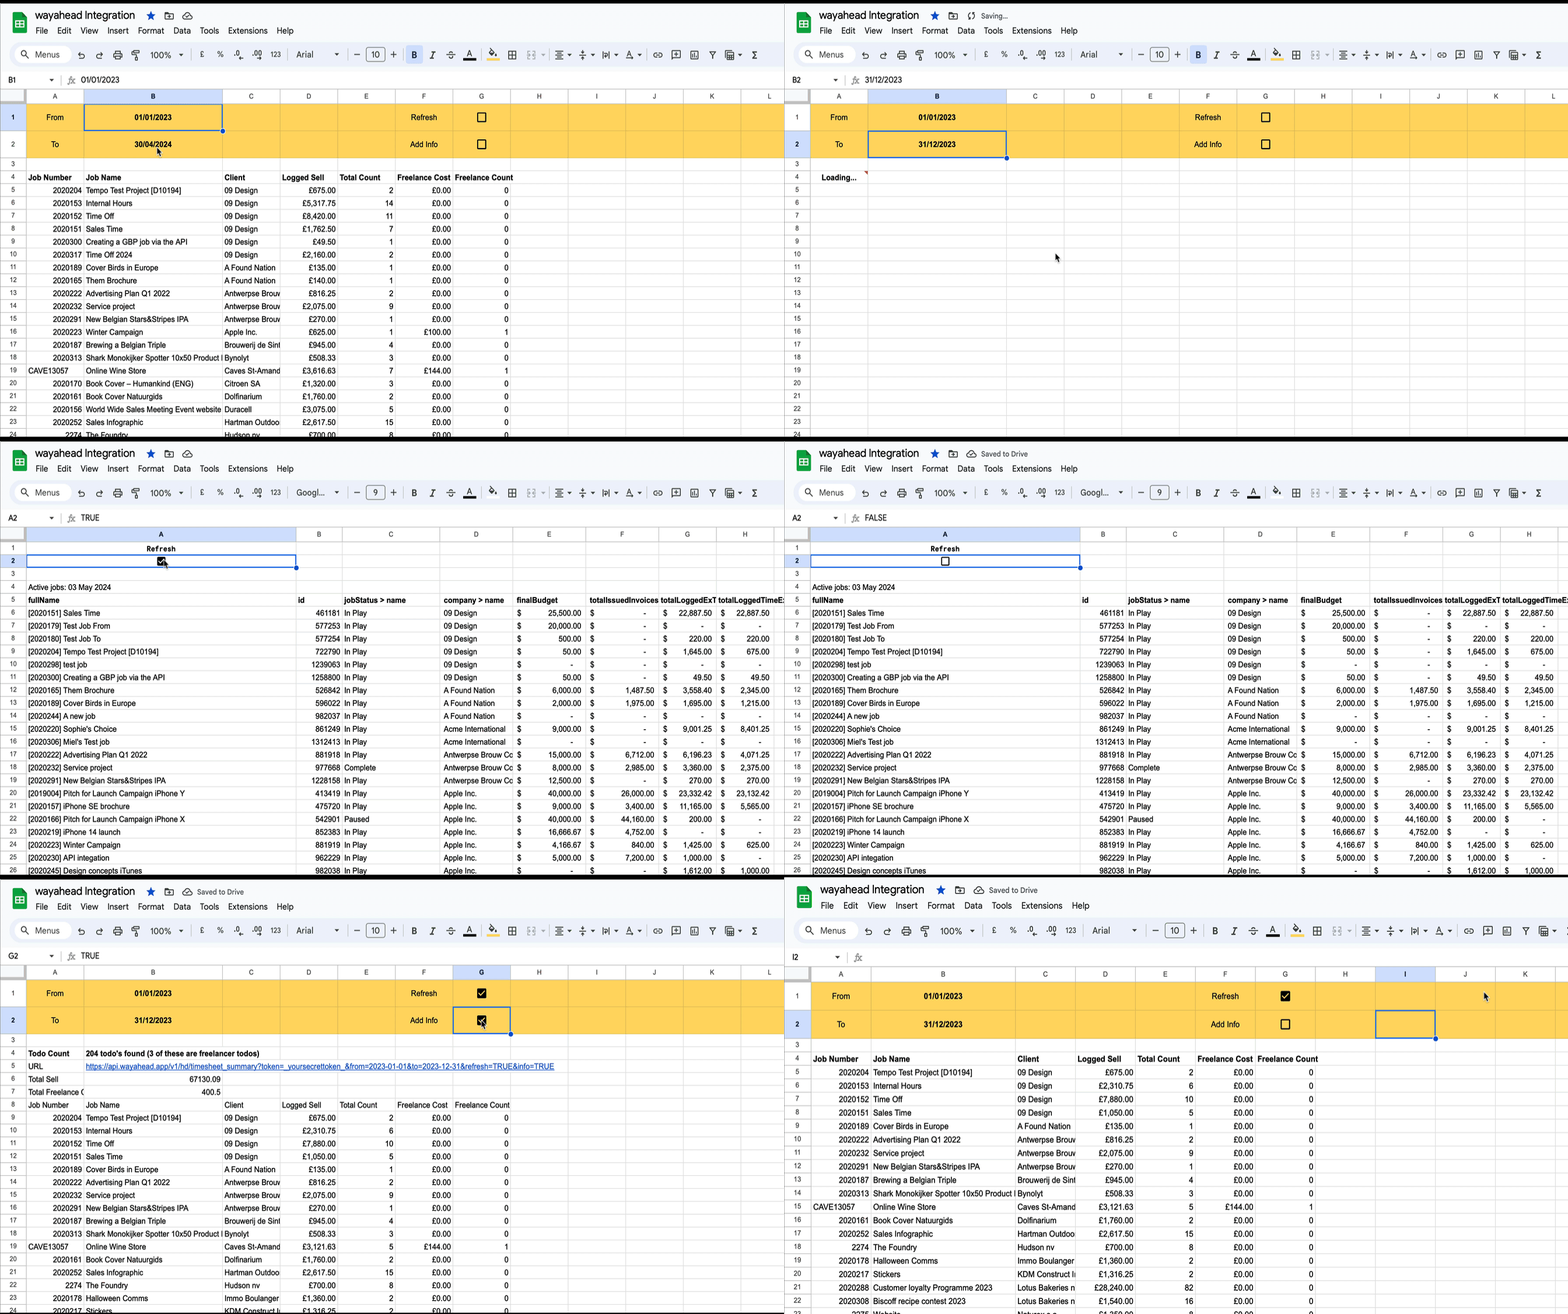
Reporting in Google Sheets
You can use Google Sheet's built in functions to create your own custom reports with Streamtime data that's always up to date. Importhtml simply calls a website/web app and fills in the returned table in the sheet.
New Interface
wayahead has a new interface! There is now more room on the page for the information that really matters: your reports! Especially on smaller the difference will be significant. And the new wayahead house style colours get a more prominent place!
